So, today I wanted to share a little project I worked on, a MUST scoring calculator. It’s not world-changing stuff, but it’s something I found myself needing, and well, I just decided to build it. Sometimes you just gotta do things yourself, you know?
My Journey with the MUST Score
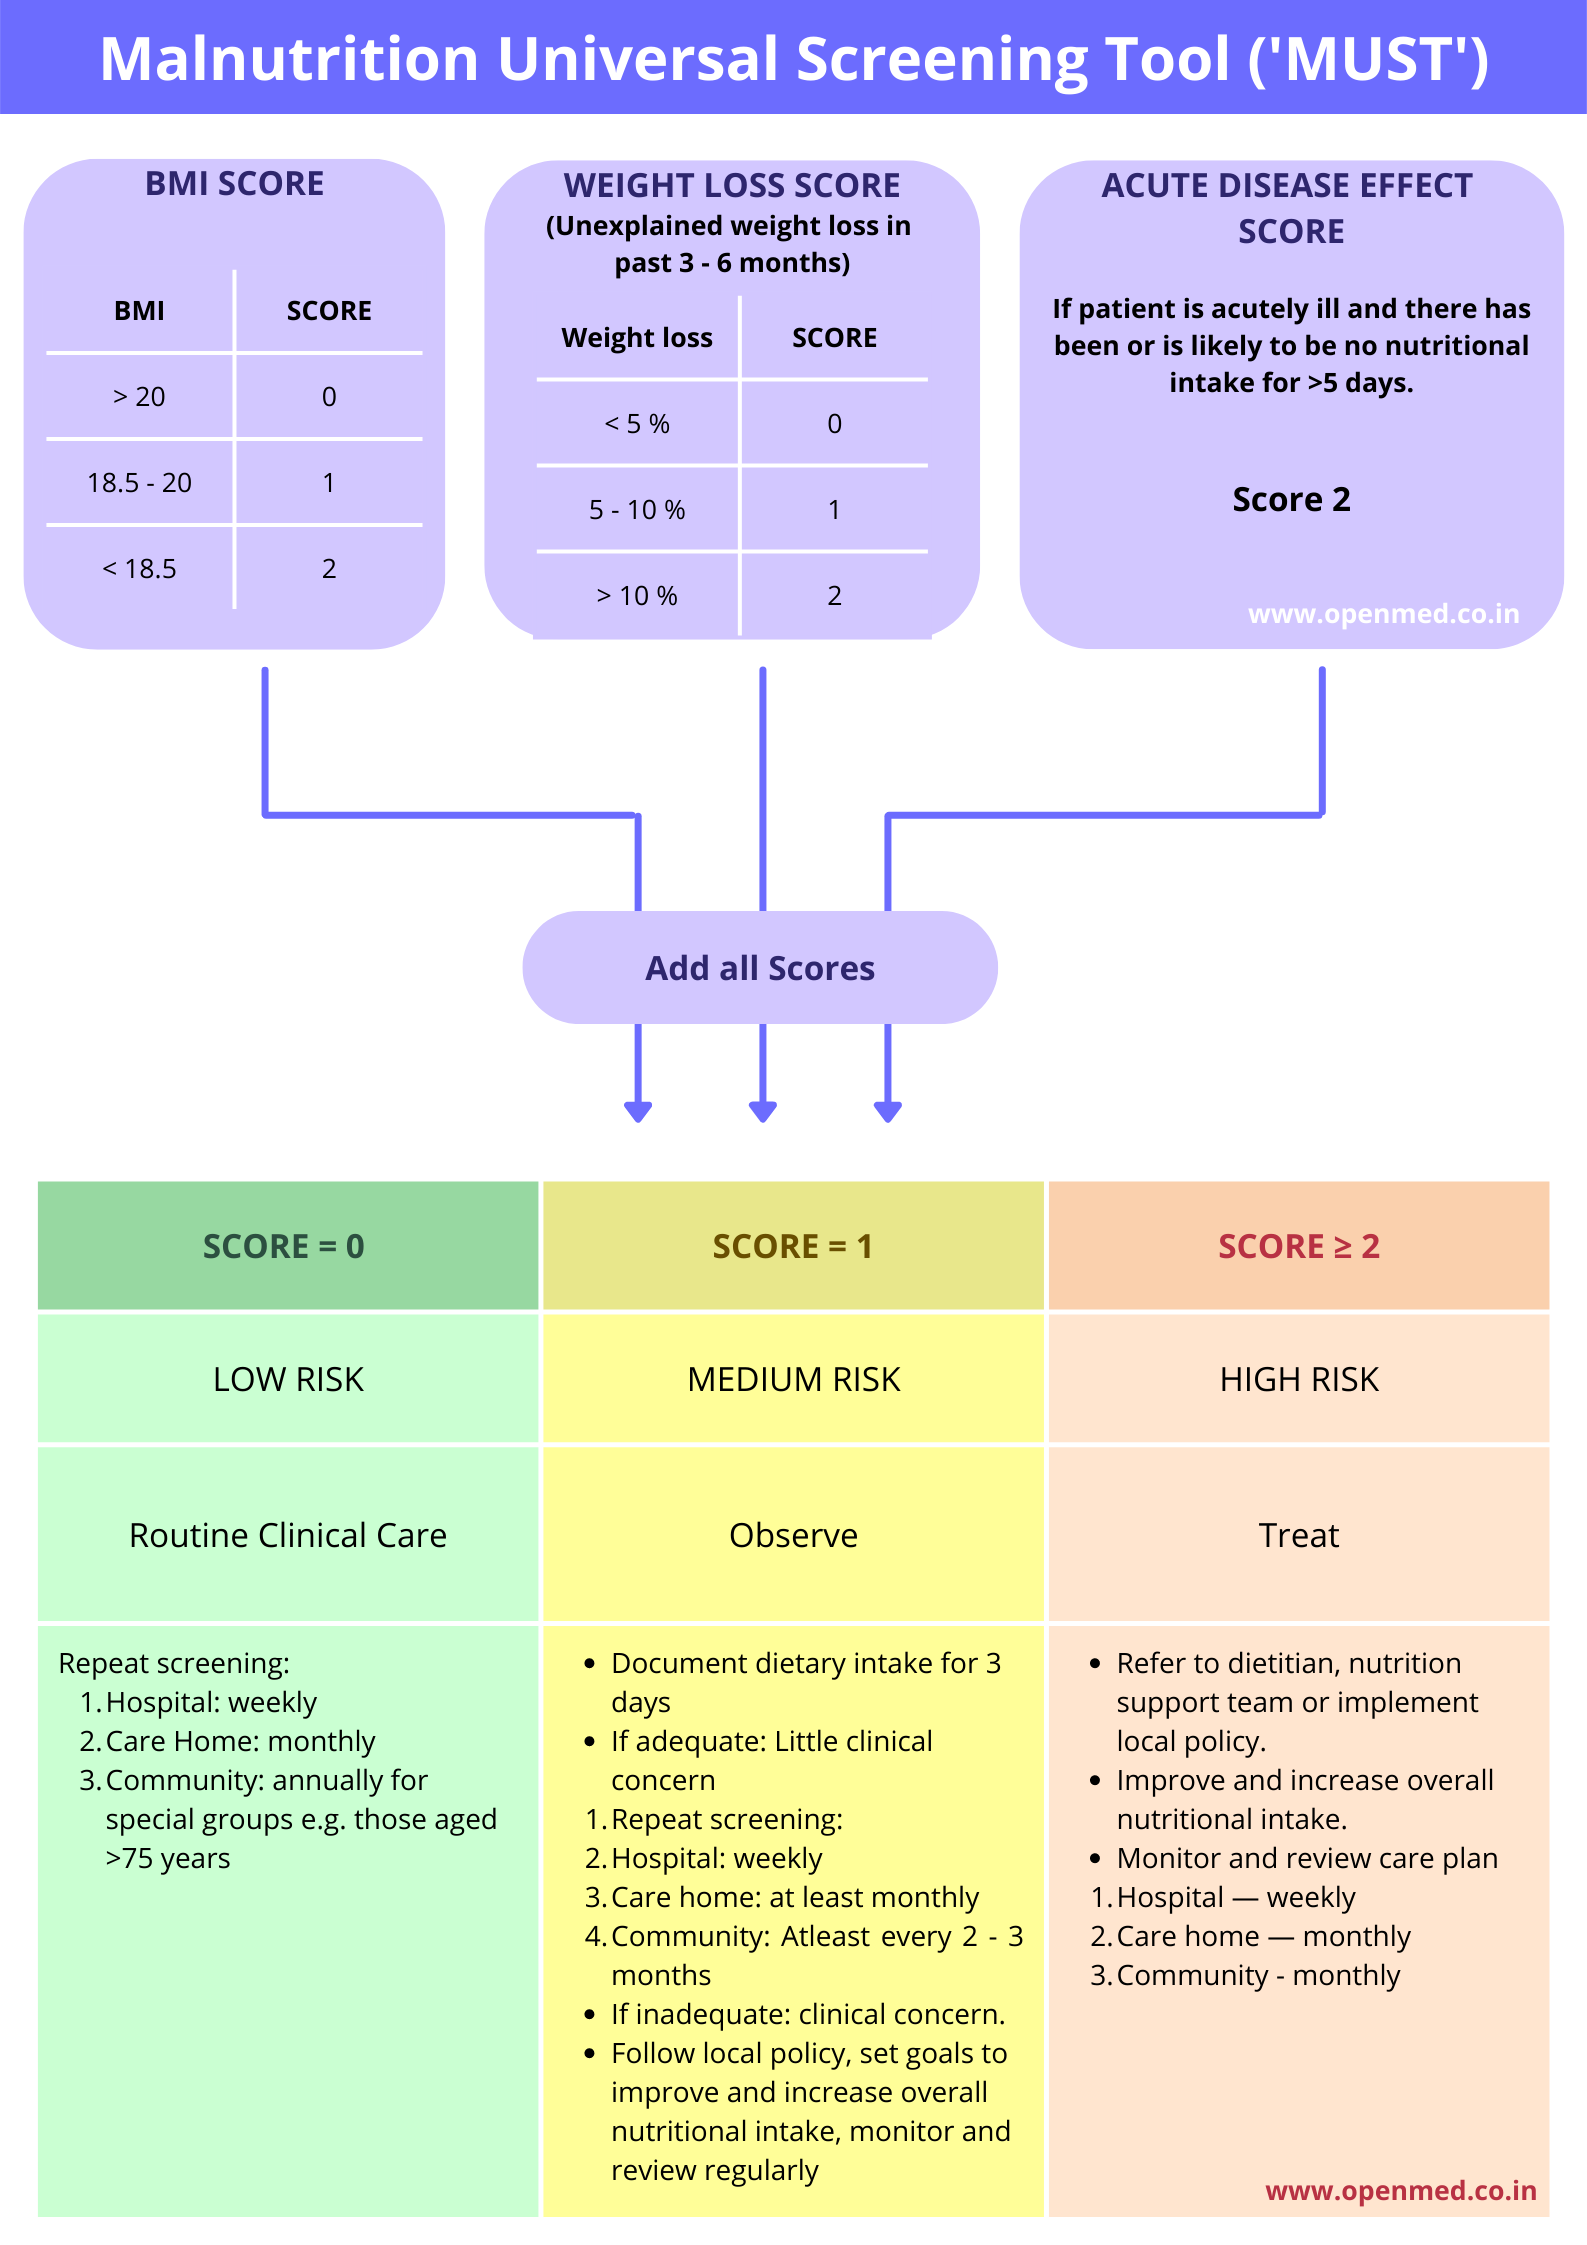
It all started when I was trying to get a handle on this MUST score thing. You hear about it, nutrition screening, all that jazz. I looked at the official charts and the steps involved. You’ve got your BMI, then you need to figure out unplanned weight loss, and then there’s this bit about acute disease effect. Seemed like a lot of flipping between papers and manual calculations. Honestly, it felt a bit clunky. I thought, there has to be a simpler way to get a quick idea, right?
My first attempts were just me with a pen and paper, trying to follow the guidelines. Calculate BMI – okay, weight in kilos, height in meters squared. Then, the weight loss percentage over the last 3-6 months. That involved remembering past weights, doing the percentage math. And then the acute disease score, which was another lookup. Add all these little scores together to get a final risk category. It worked, but it was slow, and if you’re doing it often, it’s a pain.
Building the Thing
So, I thought, “I can make a little tool for this.” I’m not a super coder or anything, but I know my way around some basic stuff. My main goal was just to automate those steps I was doing manually.
First up was the Body Mass Index (BMI). That’s pretty standard. I set up a couple of input fields: one for height, one for weight. The logic was simple: get those two numbers, do the division (weight / height²). Then, based on the result, assign a score – 0, 1, or 2, just like the MUST guidelines.
Next was the unplanned weight loss score. This one needed a percentage. So, I figured, let’s have an input for the percentage of weight lost. Again, simple logic: if it’s less than 5%, score 0. If it’s between 5-10%, score 1. And if it’s more than 10%, score 2. Straightforward enough.
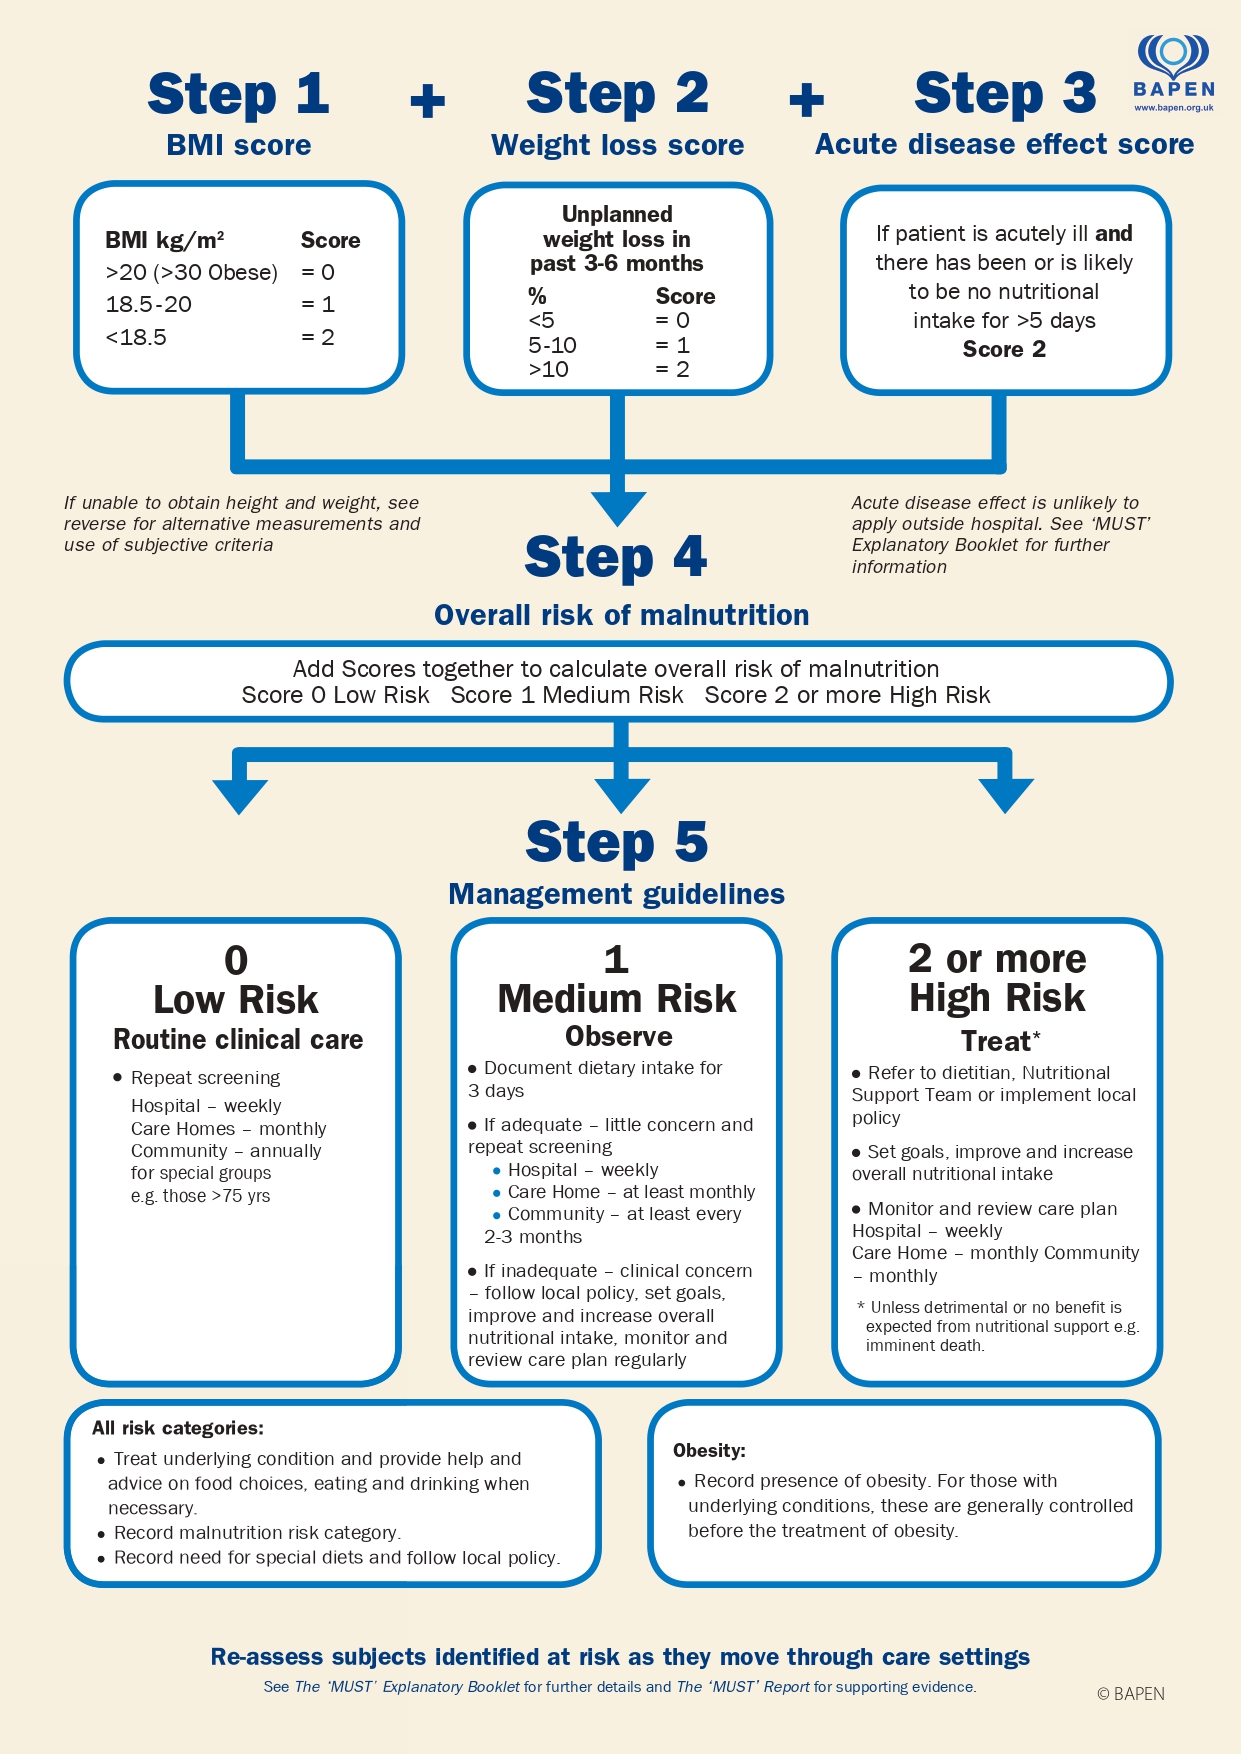
Then came the acute disease effect score. This one was a bit different. The guideline basically says if the patient is acutely ill and there has been, or is likely to be, no nutritional intake for more than 5 days, you add 2 points. So, I just made this a sort of checkbox or a simple ‘yes/no’ decision point that would add 2 to the total score if applicable.
Putting It All Together
Once I had the logic for each of those three parts, the final step was just to add up the scores.
- Score from BMI
- Score from weight loss
- Score from acute disease effect
Sum them all up, and you get your overall risk:
- 0 is low risk.
- 1 is medium risk.
- 2 or more is high risk.
I didn’t make anything fancy. No flashy graphics, no complicated database connections. Just a simple interface where you pop in the numbers, tick a box if needed, and it spits out the individual scores and the total risk. It was really about making my own life easier, and maybe for anyone else who found the manual method a bit of a drag.
And that’s pretty much it. It’s a small thing, but it does the job. Sometimes the simplest tools are the most useful, especially when you’re just trying to get a quick assessment without a whole song and dance. It’s definitely saved me some time and mental gymnastics. Just plug in the numbers and go. That’s my little practice story for today!